Live Data
Quick Links:
The Live Data interface can be broken down into two primary panels: the Navigation panel on the left and the Channel Data panel on the right.
- The navigation panel is used to select channels of data you are interested in viewing. You can also perform various data operations from the Tools toolbar.
- The channel data panel is where your selected channel(s) data is displayed. A primary feature of the channel data panel is the Filters toolbar, which lets you filter your channel(s) data just the way you want to see it. For example you can select the date-range of data you would like to view, or change the interval between each data reading.
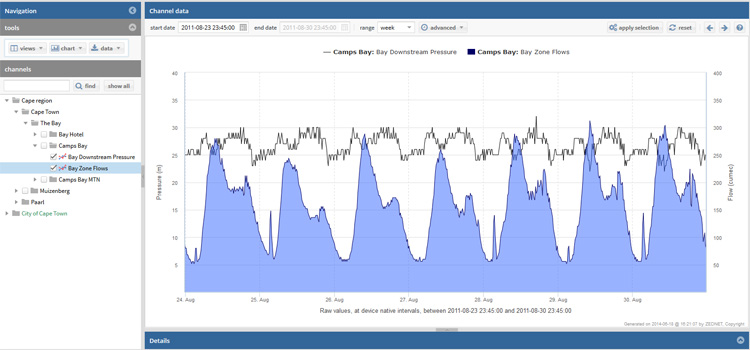
The Live Data interface, with the Navigation panel on the left and the Channel Data panel on the right.
Navigation
Situated on the left hand side of the Live Data interface is the navigation panel. Within the navigation panel you will see two sub-sections: tools and channels. The channels sub-section is used to select the channel(s) of data you are interested in viewing. The tools sub-section is used to perform data operations including: selecting how your data is displayed; viewing related data; exporting, saving, printing and emailing data.
How to view the data from one or more channels:
- In the channels panel select which region your intended site is located in
- Select which site(s) you would like to view the channel data for
- Lastly, click the check-box next to the channel(s) you would like to see displayed in the Channel Data panel.
Note: Multiple channels can be viewed simultaneously on a single chart by checking multiple channels at the same time.
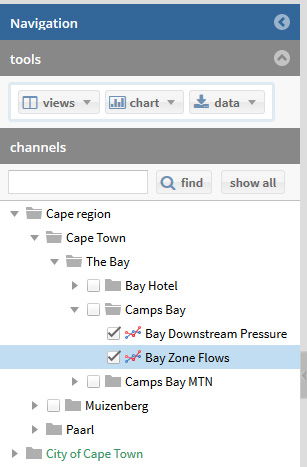
The Navigation panel: Selecting multiple channels of data to view
How to select different views of the channel data:
- In the Navigation panel expand the tools toolbar (if it is not already expanded).
- Click on the views button.
- From the drop down menu, select which views you would like to have enabled or disabled. Your selected views will then be displayed simultaneously in the Channel Data panel.
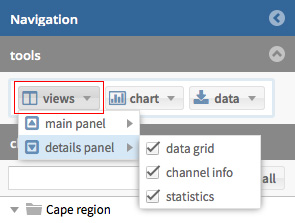
The tools toolbar: Select views button results in a drop down list of the available views
Tools: print, email, save and export chart/data
How to print, email or save a chart:
- In the tools toolbar click on the chart button
- Click the print option and follow the printing wizard to print the chart
- Click the email option and fill in the email form to send the chart via email
- Click the save option and select your desired format to save the chart as an image
Note: You can also edit the display of the chart (such as type, line colour, icon etc.) by clicking on the edit option and then clicking on edit settings in the Display column
Data Export
You can export your raw channel data out of Zednet at anytime. You can choose which channels of data you would like to export, the date period for which you would like to export as well as the format you want your data to be in. The following export formats are available:
- CSV export will give you one .csv file per channel. If you set the "reference" field for a channel in the Admin Interface, this export will use the channel "reference" as its ID in your resulting .csv file.
- Excel export will give you a single .xls file containing all your selected channel data. The first "worksheet" in the Excel document contains a weekly summary for each selected channel. Each subsequent "worksheet" represents a site and contains raw channel data for that respective site.
- WAS export works in the same way as the CSV export.
- SHEF and 5. Hydstra exports follow their respective specification and formatting. Contact support@zednet.co.za for more details.
Note: The SHEF export does not export all types of data - only those that have been allocated a SHEF code.
In brief, these data type IDs are:
7: river level (up and downstream)
8: dam or reservoir level
11: precipitation accumulator
12: precipitation
16: ph value
22: dissolved oxygen in ppm
24: water conductance
28: turbidity
How to export data from a chart or grid:
- In the tools toolbar click on the data button
- Click the export option to launch the Data Export wizard.
- Select your desired start date and end date from the start date and end date fields.
- Select which format you would like to export the data in (i.e. CSV, SHEF, EXCEL, WAS or HYDSTRA)
- Choose the channels you want to export by clicking on them in the list. If you have any channels selected in the Navigation panel these will be listed automatically, otherwise you can press the show all channels to view all your available channels.
- Once you have highlighted the channels you want to export, click the download button to save your data file in your chosen format.
Note: To print, email, save or export data, you first have to have selected at least one channel of data to view.
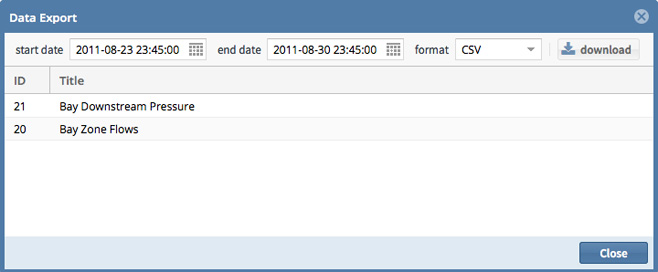
The data export wizard.
Channel Data
To the right of the Navigation panel is the Channel Data panel which displays the selected channel data in various ways. Here the selected channel data is viewed in a chart or grid and additional channel properties can also be displayed. It is possible to view the data in a chart or grid format simultaneously or separately.
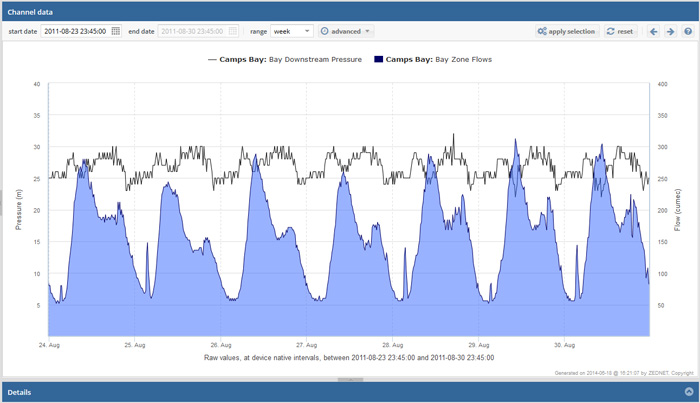
The Channel Data panel: Viewing two channels as a chart.
Filters Toolbar
The Filters Toolbar is located at the top of the Channel Data panel . With the Filters toolbar you can specify the dates, range, interval and interpolation of your chart.

The Filters Toolbar
Working with Dates and Range
You can select start and end date in order to display channel data between a specified time period. You can also select the range of data you would like to view from a specified date, i.e. day, week, month or year.
How to select a new date and a range:
- In the Filters Toolbar enter in the start date manually (year-month-day) or by clicking on the calendar icon next to the date input field and selecting a date from the calendar.
- Click on the drop down arrow next to range and select day, week, month, year or custom.
- Click apply selection in the Filters Toolbar
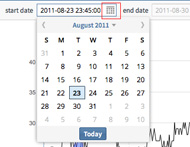
Click the calendar icon to select your start and end dates
Note: By selecting the custom option in the range dropdown menu, you will be able to set the end date manually, allowing for viewing of data for any desired length of time. Also bear in mind that - when you set the range as month, or year - the data is automatically summarised over 2 hourly intervals. Raw data over a month or year is likely to take long to download, and also to overload the browser based charting tools if you are on a slower computer. This can be changed in the advanced toolbar - see below.
You can also step forward and backwards through ranges of data (eg. the next or previous day, week, month) by clicking on the blue arrows on the right side of the Filters Toolbar
Advanced options: Interval and Interpolation
The Filters Toolbar allows you to set more advanced charting options. You can select the time interval between each point on the chart as well as the interpolation for the data points.
How to change the Interval and select the Interpolation:
- In the Filters Toolbar click on the advanced button.
- In the drop down menu, click on the arrow below interval and select your desired interval from the list.
- You can change the interpolation (eg. avg, sum, max, min) in the same way directly below the interval option in the advanced drop down menu
- Click apply selection in the Filters Toolbar
Note: Interpolation is not required when you set your interval to raw.
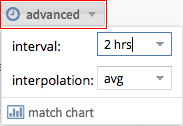
The advanced menu
Advanced options: Match chart
The match chart button in the advanced toolbar offers a quick way of setting the start and end date filters to the values that are visible on the chart at that moment. This assumes that you may e.g. have zoomed in on the chart to view a feature in more detail, and that you would like to run a query, or export data for just that period. This is particularly useful when viewing a month's data (2 hourly averages) and finding an unexpected peak in the chart. You can zoom in to the area of interest, click 'match chart' and then run the query. The chart is updated with more detailed data for just the period previously selected on the chart.
Sorting and applying data filters to a grid
- In the data grid view you can apply various sorting options and filters to manipulate how the data is represented in each column.
- Each channel has 3 columns in their respective data grid, namely: Date, Value and Meter. By simply clicking on the column heading you can toggle between sorting the data ascending or descending according to Date, Value or Meter.
- To the right of each column heading (Date, Value, Meter) is a dropdown arrow which allows for more specific actions and filters. Each column has its own filters which can be changed by selecting the relevant options in the drop-down menu. For example you can filter data between specified dates or between certain values.
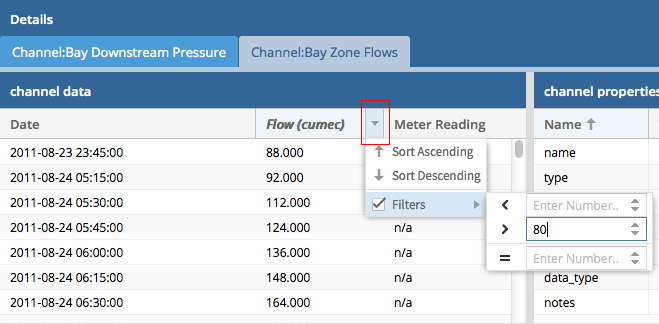
Data Grid view: Click the drop-down arrow next to each column heading to get advanced filtering and sorting options