Zednet Overview
Zednet consists of a number of modules, all working together to provide a robust system that can be used to interrogate and manipulate data coming from water distribution networks. In this section we provide a brief overview of the various modules making up Zednet. If anything seems confusing, don't worry! We will go into more detail on how to use Zednet in the Data Views and Admin Interface sections of this documentation.
- The Aggregation Module receives logger data via GSM (Global System for Mobile communications) or, alternatively, data can also be uploaded manually. It then cleans up the data by, for example, applying conversions and offsets. It then uploads the data to a centralised data store in standard format.
- From here the Query Module makes it possible to interrogate the stored data, for example, by supplying daily averages or even raw data on one or more 'data-inputs'. Typically, we refer to 'data-inputs' as channels of data coming from hardware assets installed in water distribution networks. The query module supplies data to all the Zednet front-end interfaces. Alternatively, it can be accessed via a web API (Data Export API) to integrate directly with existing 3rd party applications.
- In the Presentation Layer (or Data Views), a number of purpose specific interfaces present "views" on the data. Most of these views are interactive, allowing a user to select what data is viewed and how it is presented.
- The Live Map interface shows data channels on a Google style map, presenting a high level overview of the state of the system.
- With the Live Data interface, users can dig deeper into the system by querying specific data channels over customisable time ranges, viewing graphs, and exporting the data in different formats.
- With Zednet's Mobile Interface, users can view channel data, graphs, properties and statistics on their smart-phones and tablets, including iPads, iPhones, Windows Phone devices and any Android device.
- Finally, the Administration Module makes it possible for users to set up and configure the administrative side of their water distribution network.
- Users can be configured with different permission levels within the system.
- Automated email reports can also be set-up and configured to display daily, weekly or monthly data on a clients water distribution network.
- Hardware, including sites where water systems are being monitored, assets within those sites, like PRV chambers, water meters and reservoirs, and channels of data coming into Zednet from those assets can all be set-up and configured.
- In addition geographic information for a clients water distribution network can be customised.
The diagram below shows how the modules fit together. Each module is divided into its own block and arrows indicate the direction in which data is flowing between the modules.
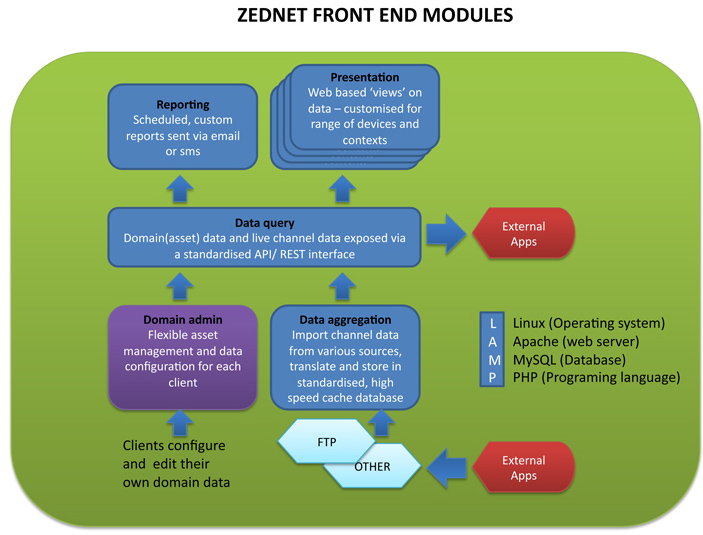
A summarised overview of how Zednet's front-end modules fit together